

One of the most important dynamics in U.S. equities over the last several years has been the widening performance gap between the S&P 500 Index and the S&P 500 Equal-Weight Index.
Although both contain the same 500 companies, the traditional S&P 500 is cap-weighted, meaning returns are driven disproportionately by the largest constituents.
In contrast, the equal weight version assigns each company roughly the same 0.2% weight. This concentration story has been covered at length; however, we think it
is useful to look beyond the headline and examine how similar market structures have behaved in the past and what that may mean going forward.
Concentration at Historic Extremes
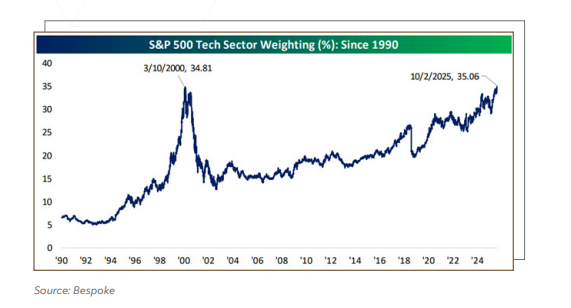
This divergence has been driven largely by the rise of the “mega-caps,” commonly referred to as the Magnificent 7. As of late October 2025, Alphabet, Amazon, Apple, Meta, Microsoft, NVIDIA, and Tesla together represent over 35% of the S&P 500’s total market capitalization, up from roughly 28% in 2023. More broadly, today’s S&P 500 is heavily tilted toward technology: as of October 2025, the sector represents approximately 35.1% of the index, surpassing the 34.8% peak seen during March 2000 at the height of the Dot-Com bubble
This means that a passive S&P 500 investor today is making one of the largest implicit bets on tech in index history. Put differently, owning an S&P 500 fund today looks more like a concentrated growth allocation, rather than the broad diversification many investors expect.
Leadership Persistence—An Historical Outlier
Historically, market leadership has been broad rather than concentrated. Since 1957, the ten largest S&P 500 stocks have historically underperformed the equal weighted basket of the remaining 490 stocks by roughly 2.4% per year.
Yet over the last decade, this relationship reversed: the ten largest stocks have outperformed by ~4.9% per year. This surge has been driven mainly by big technology companies powering cloud computing and artificial intelligence…
To continue reading, please download the full Moran Monthly Digest here.